Engineers are available to assist.

|
|
Utilize information from the UV and IR spectra |
|
|
Identify weeds, pests, and crop deficiencies for agriculture |
|
|
Analyze weather patterns, deforestation patterns, and ecosystem degradation |
|
|
Detect and diagnose subdermal diseases including cancers early |
Hyperspectral imaging (HSI) and multispectral imaging (MSI) are two related technologies that make use of specialized vision systems to acquire extra image information from extended regions of the electromagnetic spectrum aside from the visible spectrum (Figure 1).

These technologies, while similar, vary slightly and are useful for their own application spaces. While these technologies provide superior image information, the systems used feature much more complexity in lighting, filter, and optical design.
Typical machine vision systems only make use of light in the visible spectrum (from 400 to 700nm) and most machine vision sensors have peak spectral sensitives at around 550nm. Sensor sensitivity is given by the quantum efficiency curve and describes, for a particular sensor, the efficiency of converting photons of a particular wavelength into an electrical signal. However, quantum efficiencies for standard silicon sensors decrease into the UV and IR wavelengths ranges (Figure 2).

HS and MS imaging techniques make use of specialized imaging lenses and machine vision sensors to collect image detail information about the object and environment a much greater portion of the electromagnetic spectrum than standard vision systems for visible light. These specialized sensors are significantly more expensive to manufacture as they are fabricated from substrate materials different than silicon. Materials such as indium arsenide (InAs), gallium arsenide (GaAs), and indium gallium arsenide (InGaAs) are used to do imaging for wavelengths up to 2600nm, whereas imaging for wavelengths in the NIR and through to MWIR make use of mercury cadmium telluride (MCT or HgCdTe), indium antimonide (InSb) focal plane arrays, indium gallium arsenide (InGaAs) focal plane arrays, microbolometers, and few others. These specialty sensors require larger pixel sizes and precise calibrations to achieve the required sensitivities and resolutions needed.1
Though manufactured from specialty materials, these sensors function nearly the same as conventional machine vision sensors with few caveats. Machine vision camera sensors construct two-dimensional images from output grayscale arrays which are generally used to do feature recognition for sorting, measuring, or locating objects. Conventional sensors are unable to differentiate between wavelengths of light without the use of optical filters or Bayer pattern (RGB) filters restricting the wavelengths of the light incident upon the pixel.2 It is the vision software that constructs the image from wavelength information on and around neighboring pixels. In HS images, pixels capture all the same information about coordinate location (within the pixel grid) and signal intensity. However, what was previously a 2D grayscale array for conventional images becomes a 3D array, or cube, with wavelength being the added dimension (Figure 2).
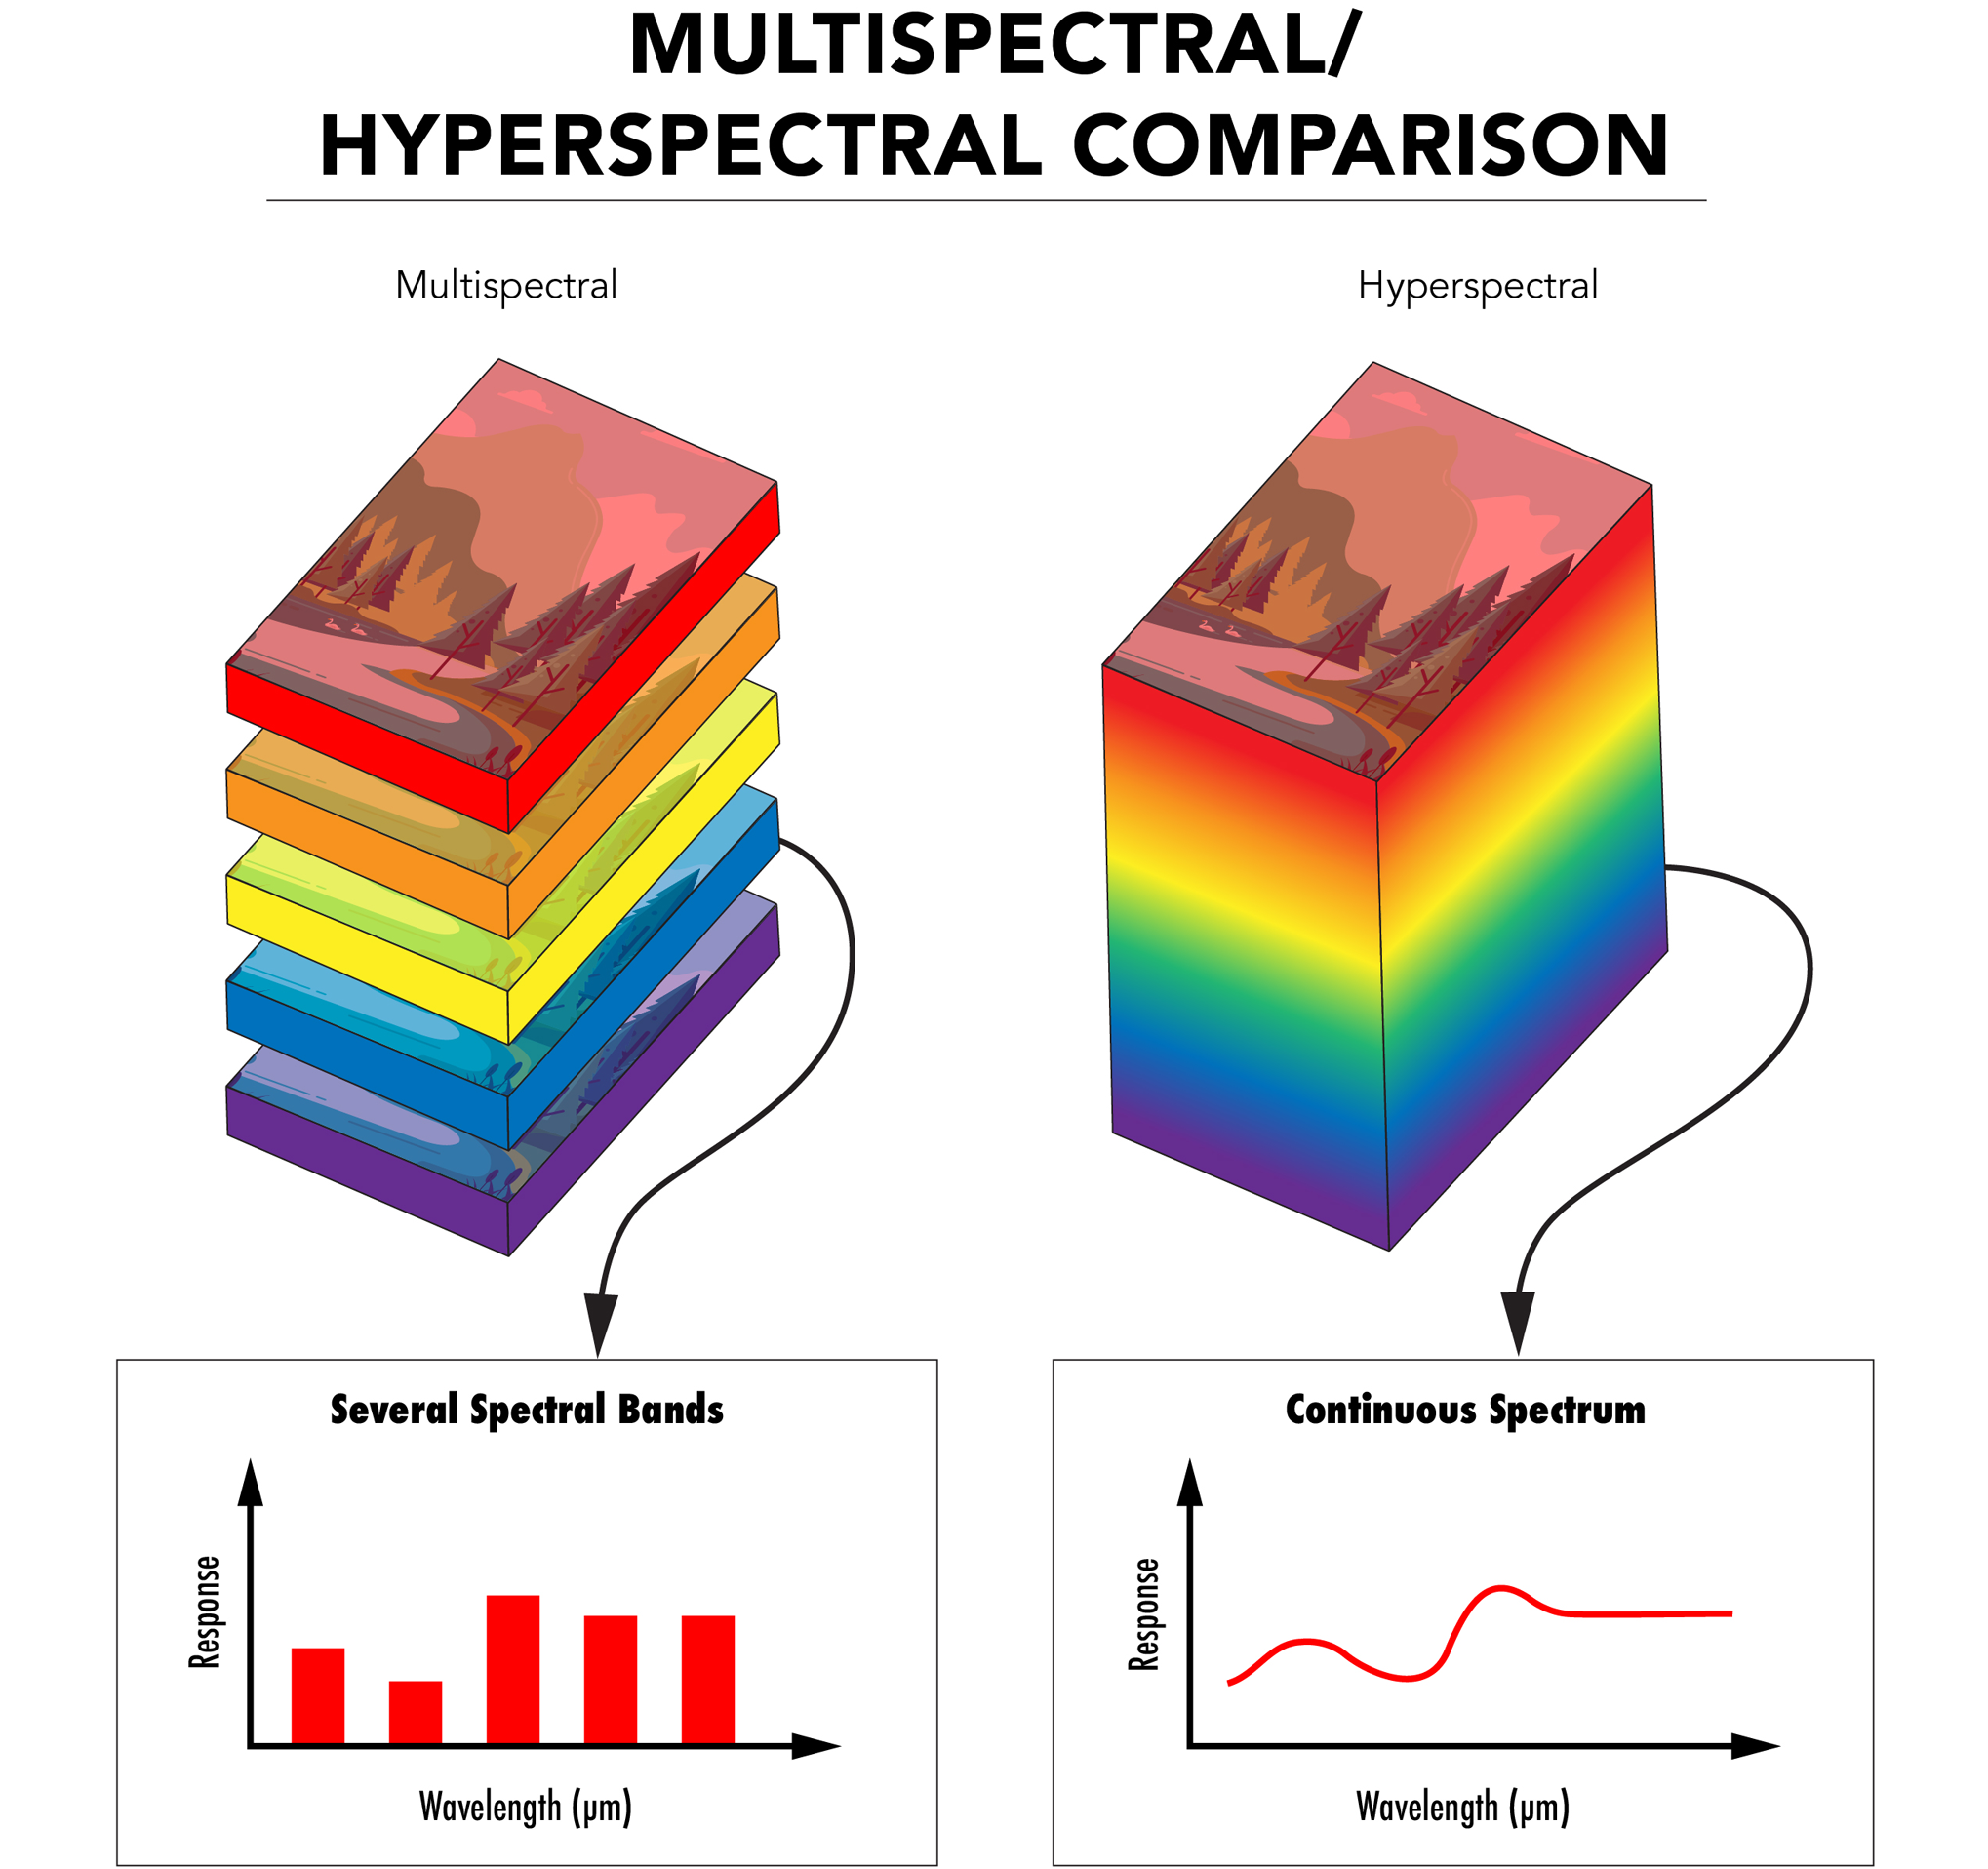
From Figure 3 above, it can be seen that wavelength information is collected for each pixel of the sensor array. The difference between MS and HS imaging is how the wavelength information is represented. MSI groups wavelength information into discrete bands and HSI is represented with a wavelength continuum. The technologies are therefore nearly identical with HS imaging having a higher wavelength resolution than MS imaging. For this reason, the two technologies present advantages over one another in different settings. HSI is best suited for applications sensitive to subtle difference in signal over a continuous spectrum. These subtle differences could be missed by an MSI system sampling larger wavebands. Selectively rejecting and capturing certain wavebands and not others is advantageous to HSI because processing fewer wavelengths means less overall processing time.
There are four main acquisition modes for obtaining wavelength information, each with a set of advantages and disadvantages. The whiskbroom method is a point scanning process that acquires spectral information for one spatial coordinate at a time and offers the highest level of spectral resolution but requires scanning the target area on both the x- and y- axes. This significantly adds to the total acquisition time.1 The pushbroom method is a line scanning method which captures and scans through a single row of pixels at a time until the full area is obtained. Systems using this method can be compact, low in weight, and have simpler operation. However, for this method, accurate exposure time is critical. Incorrect exposure times will create images with incorrect saturation for some spectral bands. The plane scanning method scans the entire 2D area and uses multiple image captures to create spectral depth. This capture method does not require translation of the sensor or system but it is critical that the object does not move during acquisition. The fourth and most recently developed acquisition method is the single shot, or snapshot, method. This method snaps a single shot and collects the entire HS data cube within a single integration period.1 This method is promising for the future of HS imaging, but is limited by lower spatial resolution and thus, requires development.1

A growing number of different application spaces utilize HSI and MSI including remote sensing and aerial imaging of the Earth’s surface with unmanned aerial vehicles (UAVs) and satellites. HSI and MSI photography can penetrate through Earth’s atmosphere and cloud cover to get an unobstructed view of the ground. This imaging is ideal to monitor population changes, observe geological activity, and study archeological sites. Additionally, HSI and MSI technology have been used to monitor and study environmental patterns about deforestation, ecosystem degradation, carbon recycling, and erratic weather systems. Researchers are able to use imaging data to create predictive models about global ecology which are helpful in combatting climate change and human impacts on nature.3
With the help of HS and MS imaging information, doctors are able to scan skin to detect cellular abnormalities including cancer non-invasively. This is due to the fact that certain wavelengths are able to penetrate deeper into skin than others. With this imaging technology, doctors no longer need to make inferences about a patient’s condition based upon their description of symptoms. Moreover, these imaging systems can automatically record and interpret spectral data, expediting diagnoses and reducing the time between diagnosis and treatment for better outcomes.4
Other industries benefiting from HS and MS imaging include agriculture, food quality and safety, and pharmaceuticals.5 Farmers are able to use spectral imaging systems attached to drones and tractors to scan large swaths of fields, analyzing the growth of crops, health of plants, the conditions of the soil, application of chemicals like pesticides, and the presence of harmful contagions or active infections. With this data, farmers can optimize the use of space and maximize production. These techniques are similarly beneficial in determining the health of natural forests, as shown in Figure 5 and Video 1.


Future developments in HSI and MSI include making these imaging systems much more compact, affordable, and user-friendly. Making this technology more accessible and easier to use across all industries will undoubtedly allow for its use in many more applications.
 Does Edmund Optics sell HSI or MSI systems?
Is HSI better that MSI or vice versa?
Does Edmund Optics sell HSI or MSI systems?
Is HSI better that MSI or vice versa?
Neither technique is better than the other, but one type of imaging may be better suited for one application over another. HSI has better wavelength resolution but takes more time to collect data and provides more data than MSI which is only sensitive to some wavelength ranges and rejects others. Thus, MSI is typically a faster and less resource intensive process.
What are HSI and MSI sensors made from and how does that differ from regular machine vision camera sensors?
Regular machine vision camera sensors are created from silicon whereas HSI and MSI sensor may be made from a variety of other materials, including but not limited to: indium arsenide (InAs), gallium arsenide (GaAs), indium gallium arsenide (InGaAs), indium antimonide (InSb), and mercury cadmium telluride (HgCdTe, also reduced to MCT).
What applications use HSI and MSI?
HSI and MSI are used in agriculture, geographical surveying, pharmaceutical production, population modeling, and many medical sciences to name just a few spaces.


or view regional numbers
QUOTE TOOL
enter stock numbers to begin
Copyright 2025 | Edmund Optics BV, De Maas 22B, 5684 PL Best, The Netherlands
California Consumer Privacy Acts (CCPA): Do Not Sell or Share My Personal Information
California Transparency in Supply Chains Act
This content may include material that has been generated or modified using artificial intelligence (AI).
The FUTURE Depends On Optics®