


Aspheric Lens Irregularity and Strehl Ratio
This is Sections 7.1 and 7.2 of the Laser Optics Resource Guide.
All optical systems have a theoretical performance limit known as the diffraction limit. Strehl ratio is a specification used to compare the real performance of an optical system with its diffraction-limited performance. For aspheric lenses and other focusing optics, Strehl ratio is defined as the ratio of peak focal spot irradiance of the manufactured optic to the diffraction-limited peak irradiance (Figure 1).1 Different aspheric lens manufacturing techniques impart unique surface errors that affect Strehl ratio differently. Understanding these effects is important to correctly specify aspheres, preventing unnecessary and costly overspecification while ensuring that desired specifications are met. This becomes increasingly crucial for fast aspheres with small f/#'s, and affects aspheres manufactured through conventional grinding and polishing more than those made through other methods. The industry standard threshold to classify a lens as “diffraction-limited” is a Strehl ratio greater than 0.8.
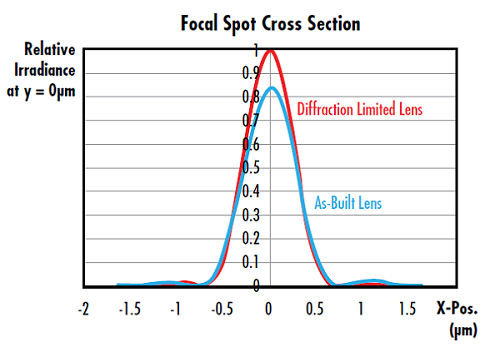
Figure 1: Irradiance cross section plot of the focal spot from a 25mm diameter f/2 aspheric lens at 588nm. The Strehl Ratio of the as-built lens is 0.826, meeting the diffraction-limited criterion
Strehl ratio can also be related to RMS transmitted wavefront error using the following approximation, where $ \small{\sigma} $ is RMS wavefront error in waves.2 This approximation is valid for transmitted wavefront error values <0.2 waves.3
Impact of Surface Irregularity on Strehl Ratio
The Strehl ratio of an optic is highly dependent on its surface irregularity, or the deviation of the optical surface from its nominal form; surface irregularity is a result of the manufacturing method used. Spherical optics are typically polished using an oversized tool, which imparts low spatial frequency errors on the optical surface. Aspherical lens manufacturing, however, typically utilizes subaperture grinding and polishing, creating a more complex irregularity structure. Understanding the relationship between a specified surface irregularity and its underlying structure can provide insight into the lens' performance and resulting Strehl ratio.
For example, consider the impact of spatial frequency. When surface irregularity is modeled as a rotationally-symmetric cosine function, we can explore the resulting Strehl ratio as a function of RMS surface irregularity for a variety of cosine periods (Figure 2 and Figure 3).
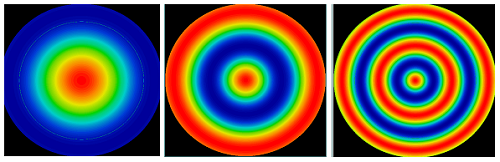
Figure 2: Typical surface irregularity errors in aspheric lens manufacturing follow cosine patterns, such as these radial cosine irregularity maps on a 25mm diameter f/2 asphere surface. The cosine periods from left to right are 20mm, 10mm, and 5mm
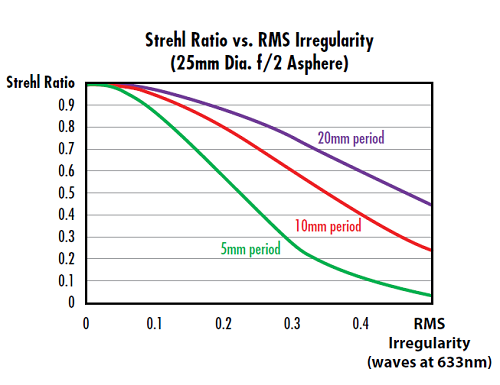
Figure 3: For a particular RMS surface irregularity, the more cosine periods over the aperture of the asphere, the lower the Strehl Ratio
The key factor here is not the period of the cosine in mm, but the number of periods over the aperture of the lens. For a given subaperture tool used in asphere manufacturing, smaller diameter aspheres will have less Strehl Ratio degradation compared to larger diameter aspheres.
The impact of surface irregularity on Strehl ratio is also dependent on the f/# of the lens. As a general rule, faster aspheres, or aspheres with smaller f/#’s, have greater sensitivity to surface irregularity’s impact on Strehl ratio. For example, Figure 4 compares an f/2 lens to an f/0.75 lens (both with 25mm diameter), and more Strehl ratio degradation is seen for the faster lenses compared to the slower lenses at a given cosine period.
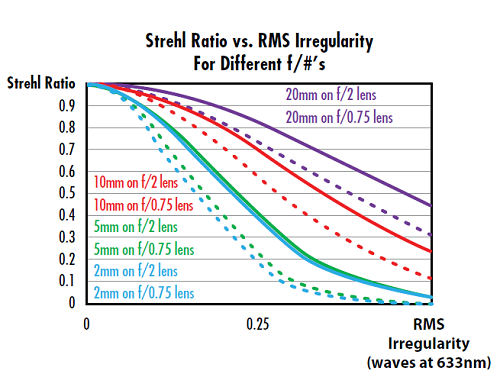
Figure 4: Comparing dotted lines to solid lines shows that a faster asphere (smaller f/#) has greater degradation compared to a slower asphere (larger f/#) over a given cosine period
Power Spectral Density and Irregularity Slope
Based on the examples above, the spatial frequency content of the irregularity maps clearly has an impact on the Strehl ratio of the lens. In addition to PV or RMS irregularity, additional specifications can be requested to target these spatial frequencies.
One specification used to directly evaluate spatial frequencies is called Power Spectral Density, or PSD.4 PSD evaluates surface irregularity as a function of spatial frequency and can be used in a targeted way to limit the contribution from a range of spatial frequencies. PSD may also be used to constrain all spatial frequencies simultaneously.
A more simple, yet effective, method to reduce higher spatial frequencies in the irregularity is to constrain the slope of the cosine functions making up the surface irregularity map, in addition to the PV value. For a given PV irregularity limit, higher slopes are associated with higher spatial frequencies on the surface (Figure 5). Slope is often given in terms of a maximum RMS slope value, which is a more comprehensive evaluation of the lens surface than a simple maximum slope requirement.5 The slope error is defined over a specified lateral distance called the integration length (Figure 6). The difference between the as-manufactured and ideal slopes is averaged over the integration length. For example, a slope specification may be given as "0.07 mrad over a 1mm integration length." Slope is defined as either the best linear fit to all data points in the integration length or simply the difference between the first and last points in the integration range.

Figure 5: If a maximum slope specification is specified for the surface irregularity map, this creates a threshold to reduce the impact of higher spatial frequency content on the surface
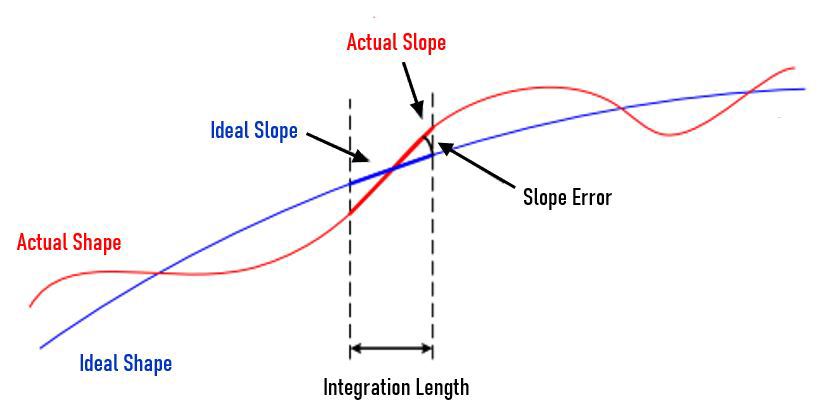
Figure 6: Slope error is the angular difference between the actual slope and the ideal slope over the integration length6
The spatial frequency of surface irregularity has a significant impact on Strehl ratio and asphere performance. The smaller the period, the more Strehl ratio degradation at a given surface irregularity. The shape of the lens’ surface irregularity map is required to understand the true impact of its surface irregularity on its performance, not just an irregularity specification by itself.7 Smaller f/#’s also lead to more degradation.
References
- Strehl, Karl W. A. “Theory of the telescope due to the diffraction of light,” Leipzig, 1894.
- Mahajan, Virendra N. "Strehl ratio for primary aberrations in terms of their aberration variance." JOSA 73.6 (1983): 860-861.
- Smith, Warren J. Modern Optical Engineering. 4th ed., McGraw-Hill Education, 2007.
- Lawson, Janice K., et al. "Specification of optical components using the power spectral density function." Optical Manufacturing and Testing. Vol. 2536. International Society for Optics and Photonics, 1995.
- Messelink, Wilhelmus A., et al., "Mid-spatial frequency errors of mass-produced aspheres," Proc. SPIE 10829, Fifth European Seminar on Precision Optics Manufacturing, 7 Aug. 2018, doi:10.1117/12.2318663.
- Ceyhan, U. (2013). Characterization of aspherical lenses by experimental ray tracing [Doctor of Philosophy in Electrical Engineering thesis]. Jacobs University.
- Kasunic, Keith J., Laser Systems Engineering, SPIE Press, 2016. (ISBN 9781510604278)
More Resources
- All About Aspheric Lenses
- How an Aspheric Lens is Made Video
- Aspheric Lens Takeover
- Need an Asphere Fast?
- Understanding Optical Specifications
- Computer Generated Hologram Metrology
- Aspherized Achromatic Lenses
- Laser Optics Lab Video Series


or view regional numbers
QUOTE TOOL
enter stock numbers to begin
Copyright 2025 | Edmund Optics BV, De Maas 22B, 5684 PL Best, The Netherlands
California Consumer Privacy Acts (CCPA): Do Not Sell or Share My Personal Information
California Transparency in Supply Chains Act
This content may include material that has been generated or modified using artificial intelligence (AI).
The FUTURE Depends On Optics®