


Laser Power Density versus Energy Density
Power and energy densities are two important concepts to understand when dealing with laser optics. These two terms are often used interchangeably but have different meanings. Table 1 defines power density, energy density, and other related terms as they relate to laser optics.
| Metric | Definition | Units |
| Power | Energy of light per unit time, such as the energy delivered by a laser beam. | W or J/s |
| Energy | Potential energy stored in electromagnetic radiation, found by integrating power with respect to time. | J |
| Power Density | Power per unit area, also known as irradiance. | W/cm2 |
| Energy Density | Energy per unit area, also known as fluence. | J/cm2 |
| Linear Power Density | Linear distribution of a flat top beam’s power describing the laser-induced damage threshold (LIDT) of continuous wave (CW) lasers through total power divided by 1/e2 beam diameter. Linear power density is only applicable to flat top beams and must be adjusted for Gaussian beams. | W/cm |
| Peak Irradiance | The maximum irradiance, or optical power density, reached over the duration of a laser pulse.5 | W/cm2 |
| Pulse Energy | The maximum optical energy reached over the duration of a laser pulse. | J |
| Volumetric Power Density | Power over a three-dimensional volume, which considers the depth of laser penetration into a sample in applications like materials processing. | W/cm3 |
| Volumetric Energy Density | Energy over a three-dimensional volume, which considers the depth of laser penetration into a sample in applications like materials processing. | J/cm3 |
Table 1: Definitions of common metrics used to describe laser beams and other electromagnetic radiation.
In most scientific disciplines, including chemistry and electrical engineering, “power density” and “energy density” typically describe a three-dimensional volume. However, in optical sciences the terms are typically used to describe a two-dimensional area, unless described as “volumetric.” Power density, energy density, fluence, and irradiance are often used interchangeably in the optics industry, which can be completely inaccurate, especially if it is not clear if the metric is a two- or three-dimensional value. This is particularly important for laser cutting and welding applications because the depth of laser penetration must be considered as opposed to simply encountering the surface. Volumetric values are typically more applicable to these situations and is an important distinction that must be understood to avoid miscommunication.
Most laser beams have a Gaussian beam profile, so irradiance and fluence are both highest on the optical axis of the laser and decrease as deviation from the axis increases.6 Other lasers have flat top beam profiles which, unlike Gaussian beams, have a constant irradiance profile through the cross-section of the laser beam and a quick drop off in intensity. Consequently, flat top lasers do not have a peak irradiance. The peak power of a Gaussian beam is double that of a flat top beam with the same average power (Figure 1).

Figure 1: Comparison of a Gaussian beam profile with a flat top beam with the same average power, showing that the Gaussian beam has a peak power greater than that of the flat top beam by a factor of two.
Hotspots, or local fluctuations in irradiance, in a laser beam can often skew its Gaussian distribution. Hotspots will not affect peak irradiance unless the hotspot power exceeds that on the optical axis, but hotspots will skew all of the various power and energy density metrics. Both power and energy densities are volumetric amounts, so the resulting cut made by the laser may not be as accurate and could be off-center. In micromachining applications, users will not be able to discern the problem by simply measuring irradiance or fluence. Instead, the beam profile will need to be carefully monitored. As shown in Figure 2, a Gaussian distribution resembles a bell curve where the peak irradiance is in the center and irradiance drops off equally on both sides. Introducing a hotspot will skew this distribution.
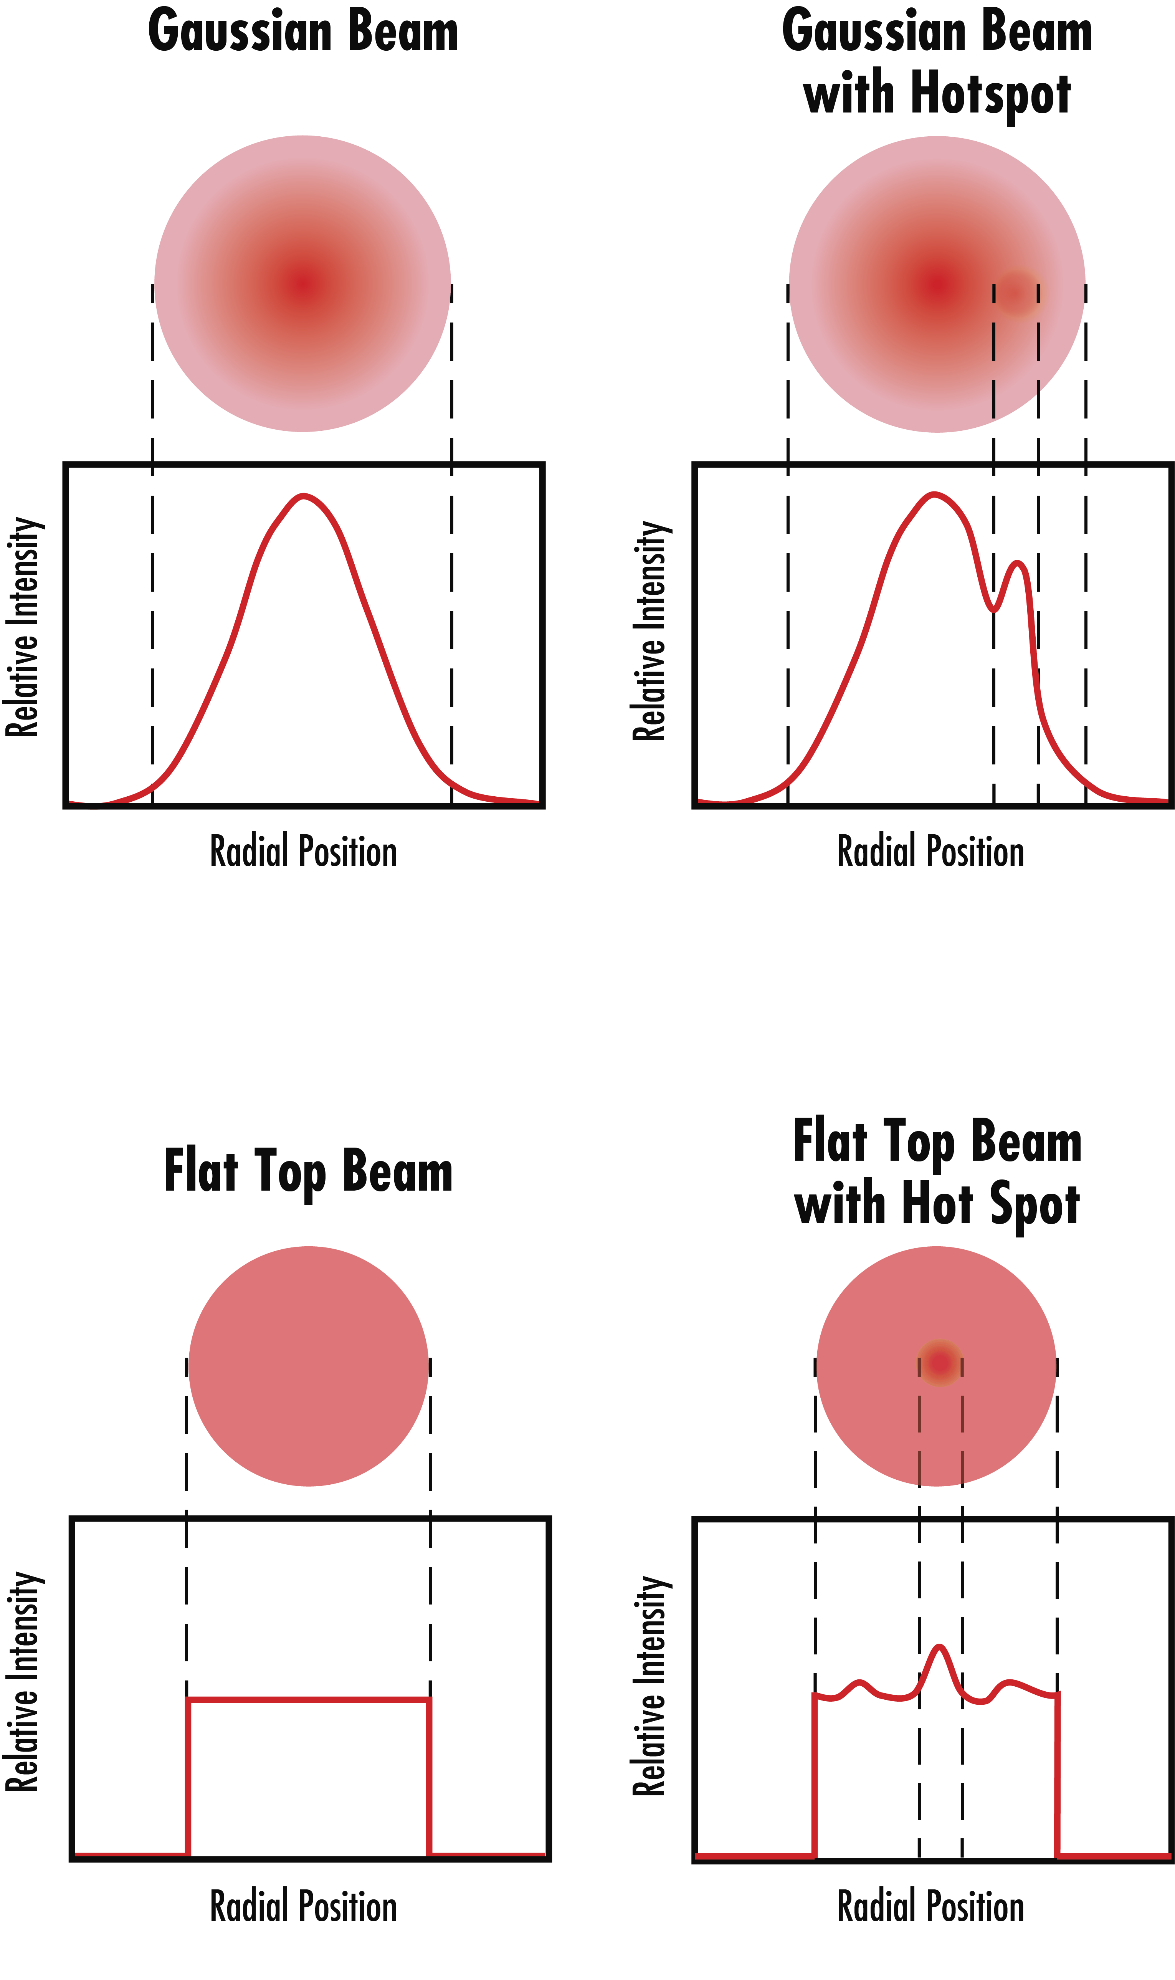
Figure 2: Depiction of hotspots skewing the intensity distributions on both Gaussian and flat top beams.
Continuous wave (CW) lasers require correct terminology to accurately describe their performance. They have no pulses by definition, therefore peak irradiance cannot be applied. Linear density is the appropriate term to use for CW lasers with uniform beam intensity and is typically used to determine LIDT by dividing average power by the beam diameter. For quasi-CW lasers, ultrafast pulsed lasers with a repetition rate above 50 KHz, the peak irradiance can be significantly higher than that of a normal pulsed laser with equivalent average power. This is due to the equivalent average power being condensed into an incredibly short pulse duration. The peak irradiance of quasi-CW lasers is much higher than the irradiance of CW lasers, even if they have the same fluence.
References
- Paschotta, D. (2020, March 14). Power Density. Retrieved June 29, 2020, from https://www.rp-photonics.com/power_density.html
- Power density. (n.d.). Retrieved June 29, 2020, from https://energyeducation.ca/encyclopedia/Power_density
- Xiang, Z., Yin, M., Dong, G., Mei, X., & Yin, G. (2018, March). Modeling of the thermal physical process and study on the reliability of linear energy density for selective laser melting. Results in Physics, 9, 939-946. doi:10.1016/j.rinp.2018.03.047
- Paschotta, D. (2020, March 14). Irradiance. Retrieved June 29, 2020, from https://www.rp-photonics.com/irradiance.html
- Becker, J. (2018, April). Peak Irradiance & Energy Density. Phoseon Technology.
- Paschotta, D. (2020, May 03). Fluence. Retrieved June 29, 2020, from https://www.rp-photonics.com/fluence.html
More Resources
- Gaussian Beam Propagation
- Different Types of LIDT Specifications
- Understanding and Specifying LIDT of Laser Components
- Laser Optics Lab Video Series
- Key Parameters of a Laser System
- Beam Shape, Beam Quality, and Strehl Ratio
or view regional numbers
QUOTE TOOL
enter stock numbers to begin
Copyright 2025 | Edmund Optics BV, De Maas 22B, 5684 PL Best, The Netherlands
California Consumer Privacy Acts (CCPA): Do Not Sell or Share My Personal Information
California Transparency in Supply Chains Act
This content may include material that has been generated or modified using artificial intelligence (AI).
The FUTURE Depends On Optics®