


Basic Principles of Raman Scattering and Spectroscopy
Authors: Chase Toncheff,Emily Bishop
Raman scattering is a physical process in which the direction, and more importantly, the energy of incoming light changes as it scatters off of a sample. Light that interacts with a sample can experience one of a few different phenomena; most of the light is absorbed, transmitted, or reflected through the sample. However, a small amount of that light is scattered in one of three ways: Rayleigh, Stokes Raman, or anti-Stokes Raman scattering (Figure 1).
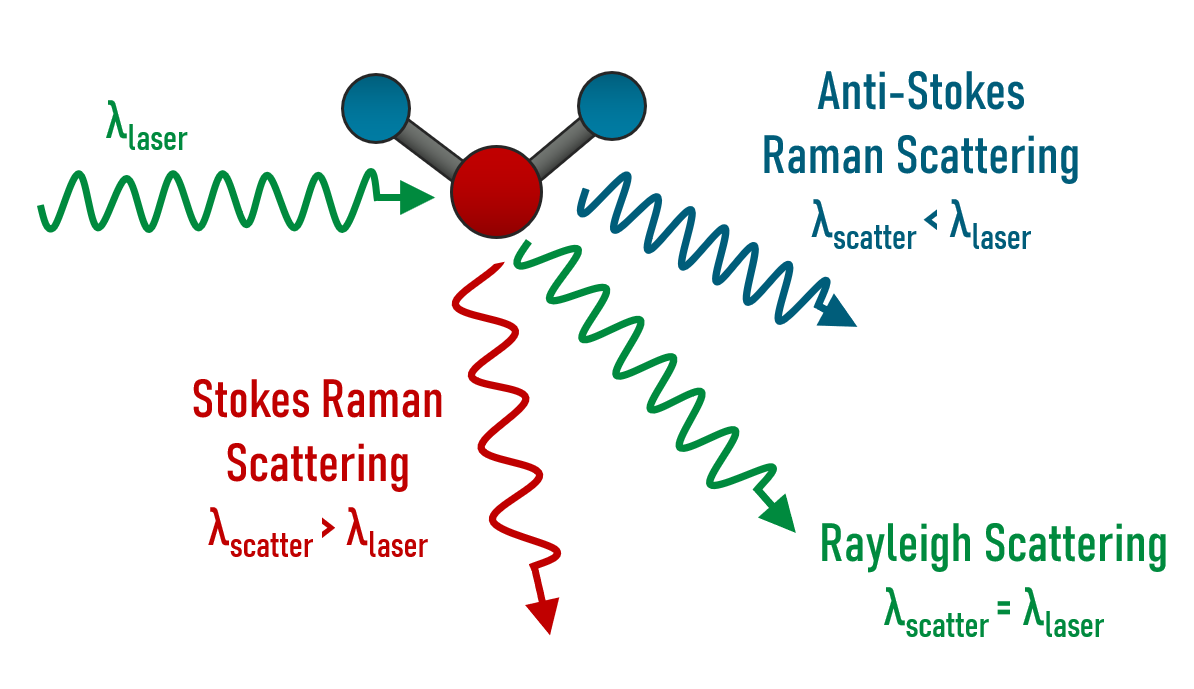
Figure 1: Example of the three different scatter mechanisms with a given input wavelength and the comparison to the scattered wavelengths.1
Stokes Raman Scattering
Any scattering process can be classified as either elastic or inelastic: elastic scattering occurs when the incoming photon is scattered with the same amount of energy as when it entered the system; inelastic scattering occurs when the incoming photon is scattered with either higher or lower energy than it originally contained. Rayleigh is a form of elastic scattering while Stokes Raman and anti-Stokes Raman are inelastic. The differentiating characteristic of the two types of inelastic scattering is dependent on the energy of the scattered photon. One scenario occurs when the photon interacts with the material and the photon first excites the material to a higher energy virtual state, then relaxes down to a higher energy vibrational state. The photon transfers energy to the molecule, meaning that the scattered photon is at a lower energy, thus a longer wavelength. This effect is known as Stokes Raman scattering. On the contrary, when the molecule starts in the higher energy vibrational state and is excited to the virtual state via photon interaction, when it relaxes back down to a lower energy level, it will go down to a lower vibrational energy level. The scattered photon will gain energy from this interaction and scatter at a shorter wavelength. This effect is known as anti-Stokes Raman scattering. Raman spectroscopy is often confused with Fourier-transform infrared spectroscopy (FTIR) spectroscopy; however, FTIR is the direct transition between vibrational states.
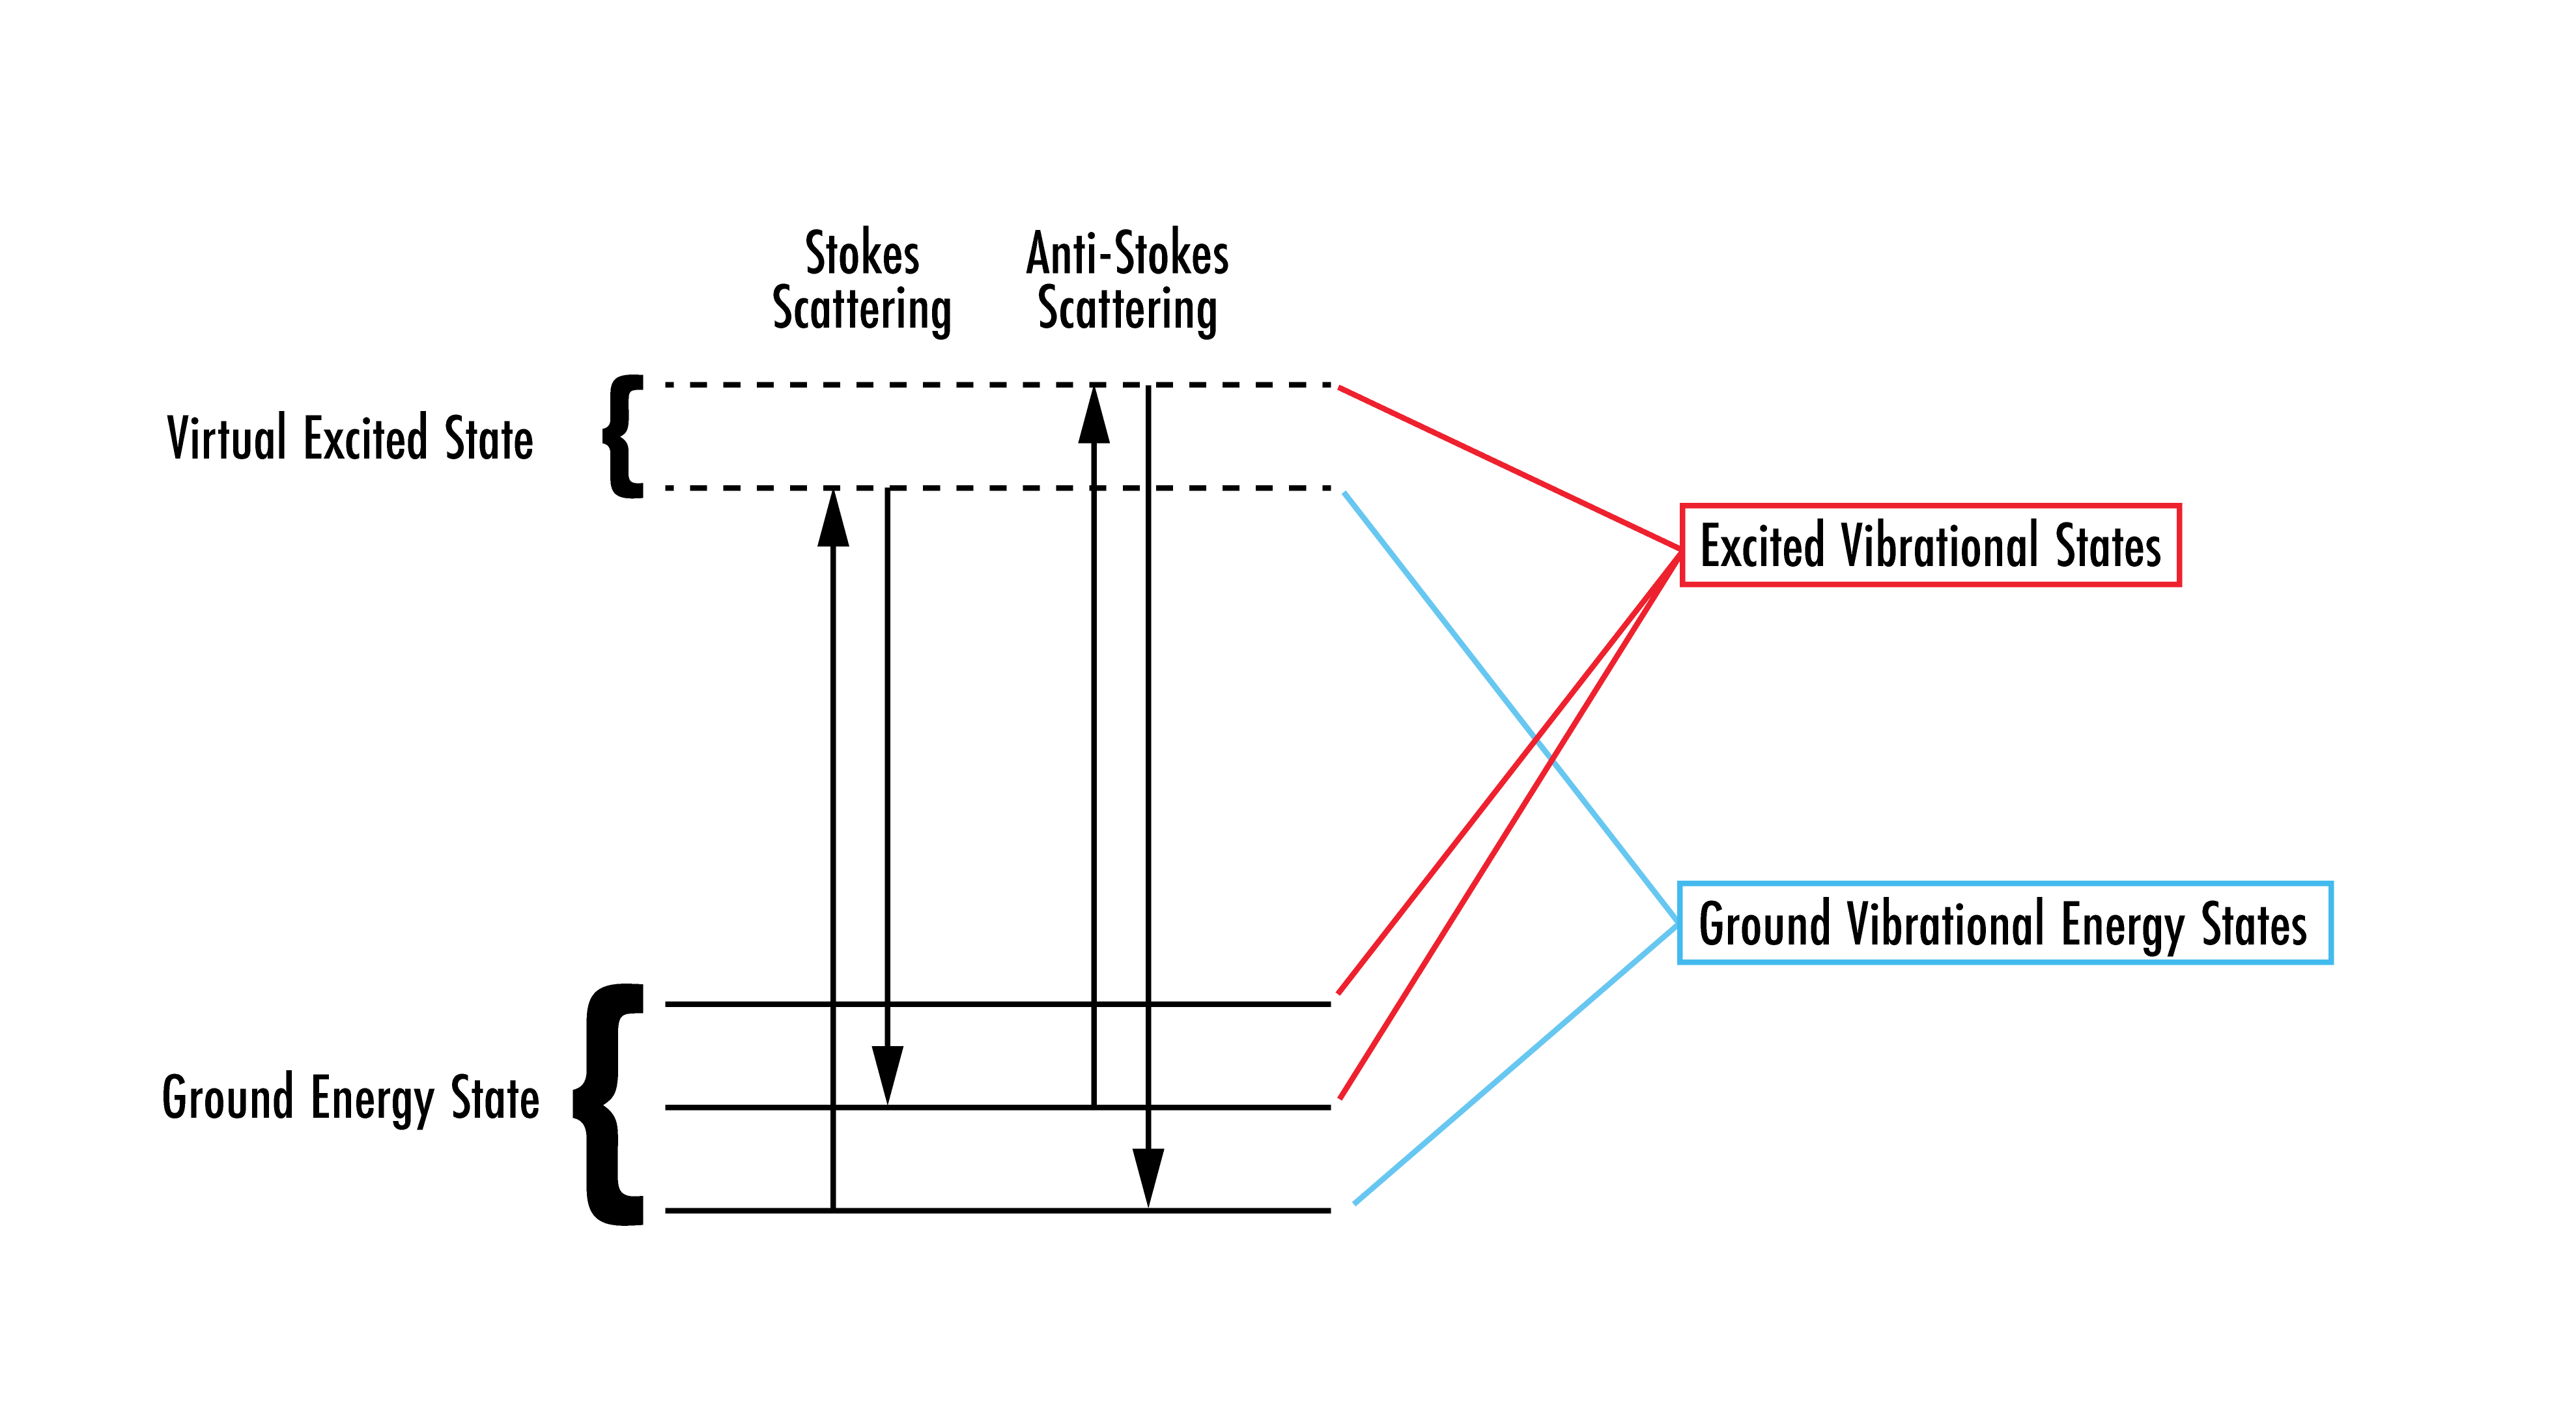
Figure 2: Showing the two different types of inelastic scattering processes. Note: the virtual excited state is not the first excited state of a molecule.2
Stokes Raman scattering is much more common than anti-Stokes Raman due to the fact that anti-Stokes Raman requires that the molecule already be at an excited vibrational state.2 This means that, although anti-Stokes Raman has a higher energy than Stokes Raman, the intensity is generally much less. Thus, Stokes scattering is typically used in Raman spectroscopy measurements.
What is Raman Spectroscopy?
The Raman spectroscopy technique is one of the most effective methods of determining the chemical composition of a sample via Raman scattering.3 In this spectroscopy technique, a sample is excited by a monochromatic light source, such as a laser, and the Raman Shifts are collected. Raman Shifts are frequency shifts that occur when monochromatic light scatters off of a sample and produces a different frequency than that of the original light source. This can be used to find the change in energy of the photon, which is the same energy difference from the ground vibrational state to the excited state. This process is used to create a unique fingerprint from which the sample can be identified. The Raman effect is best measured with monochromatic light sources, such as lasers. Because of the slight difference in wavelengths of the excitation and scattering photons due to the Raman scattering, the Raman effect would likely be overshadowed by a broadband source. This means that the wavelength of the source is a key specification, affecting the resolution, intensity, and even the cost of a Raman spectroscopy setup. The choice of laser can span from the ultraviolet (UV) to the infrared (IR), and different wavelengths have different pros and cons depending on the application.4
This spectroscopy technique has grown in popularity for use in life science and medical applications as a way to noninvasively analyze a sample and identify the different components within. It is also used in solid-state physics and chemistry to identify both organic and inorganic materials. A key benefit of Raman spectroscopy is that it is a nondestructive way to assess samples without manipulating the sample or using dyes or labels.
Layout of a Raman Spectroscopy Setup
Virtually every Raman setup includes a laser that excites the sample and a detector to collect the emission signal. Additional optics are integrated into the system to focus the beam and optimize the setup to improve signal quality. A simple Raman spectroscopy setup may include an Nd:YAG laser, two mirrors on kinematic mounts, two right angle prisms, and an achromat lens. The light from the laser hits two mirrors for alignment purposes, as shown in the configuration illustrated in Figure 2, and is folded 90° by a right angle prism. An achromatic lens then focuses the light onto the sample. The light that scatters off the sample hits the second prism mirror, which deflects it into a beam dump. The achromat then gathers the scattered light and focuses it onto the detector for collection.4
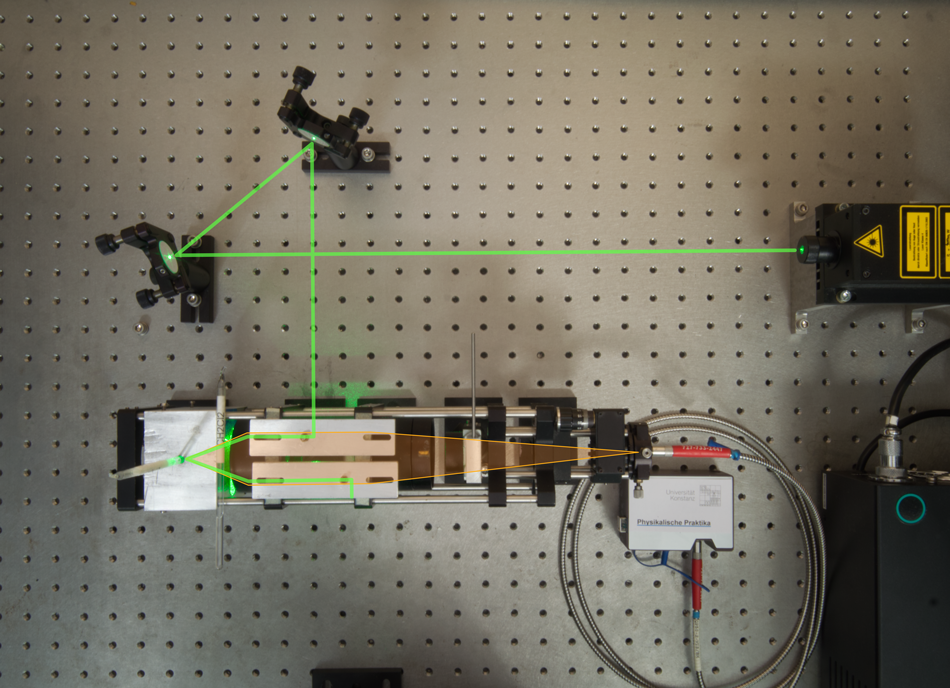
Figure 3: Setup for Raman spectroscopy.4
Laser Power Considerations
For numerous sample types, using a near-infrared (NIR) excitation laser is advantageous because many substances will fluoresce at wavelengths close to UV light, and this fluorescence will overshadow any scattering measurements making it nearly impossible to record any meaningful data. This does not suggest that higher wavelengths represent better systems; one thing to consider when using NIR is higher noise and cost. Commonly, a good balance between performance, fluorescence, and cost is a 785nm NIR laser.5 One of the issues that comes along with using NIR lasers is they tend to emit a higher power. In order to effectively conduct Raman spectroscopy with this sort of laser, it is critical that the optical components used in the system have a high enough laser damage threshold to be compatible with the particular laser source being used. However, it is important to understand that due to the statistical nature of laser damage testing, this threshold is not the power at which damage will never occur. Rather, the laser damage threshold is defined as the limit at which the damage probability is less than a critical risk level. This depends on several factors—such as beam diameter, number of test sites per sample, and number of samples tested—to determine the specification. You can learn more in our Understanding and Specifying LDT of Laser Components application note.
Signal to Noise Ratio
In terms of performance, a high signal-to-noise ratio (SNR) is beneficial for detecting the low efficiency of Raman shifts. A good example of why a high SNR is important is the analysis of fluorescent samples, which are notoriously difficult to investigate using Raman spectroscopy. As mentioned earlier, the signal generated from the fluorescent material becomes a dominant source of noise, overpowering the Raman scattering. Since simply increasing the power of the laser would also increase the fluorescence signal, fluorescence is usually mitigated by changing the wavelength of the excitation laser.
Detector Selection
One way to improve the signal being extracted is to use a laser with a shorter wavelength, and consequently a higher photon energy, to ensure that the energy of the light is higher than that of the energy gap between the electronic ground and excited states. The detector’s responsivity should also be considered. For example, when using a 532nm laser, the resulting scattered photons will be distributed in the visible range, thus, a detector should be chosen that has high quantum efficiency in the visible spectrum, such as a charge-coupled device (CCD). However, when using an NIR laser, such as an Nd:YAG with a wavelength of 1064nm, indium gallium arsenide (InGaAs) detectors are ideal due to their high responsivity in the NIR region. This is an easy way to increase the signal on the detector without compromising overall design.
Back-thinned CCDs are ideal options for the low light detection of Raman spectroscopy because their quantum efficiency gets as high as 90 percent at their peak wavelength.6 These detectors have high quantum efficiencies in the visible and UV spectra because incident light interacts directly with the sensor’s active region. NIR back-thinned CCDs with improved quantum efficiencies in the NIR and red wavelength regions can also be used to increase the SNR for longer wavelengths.
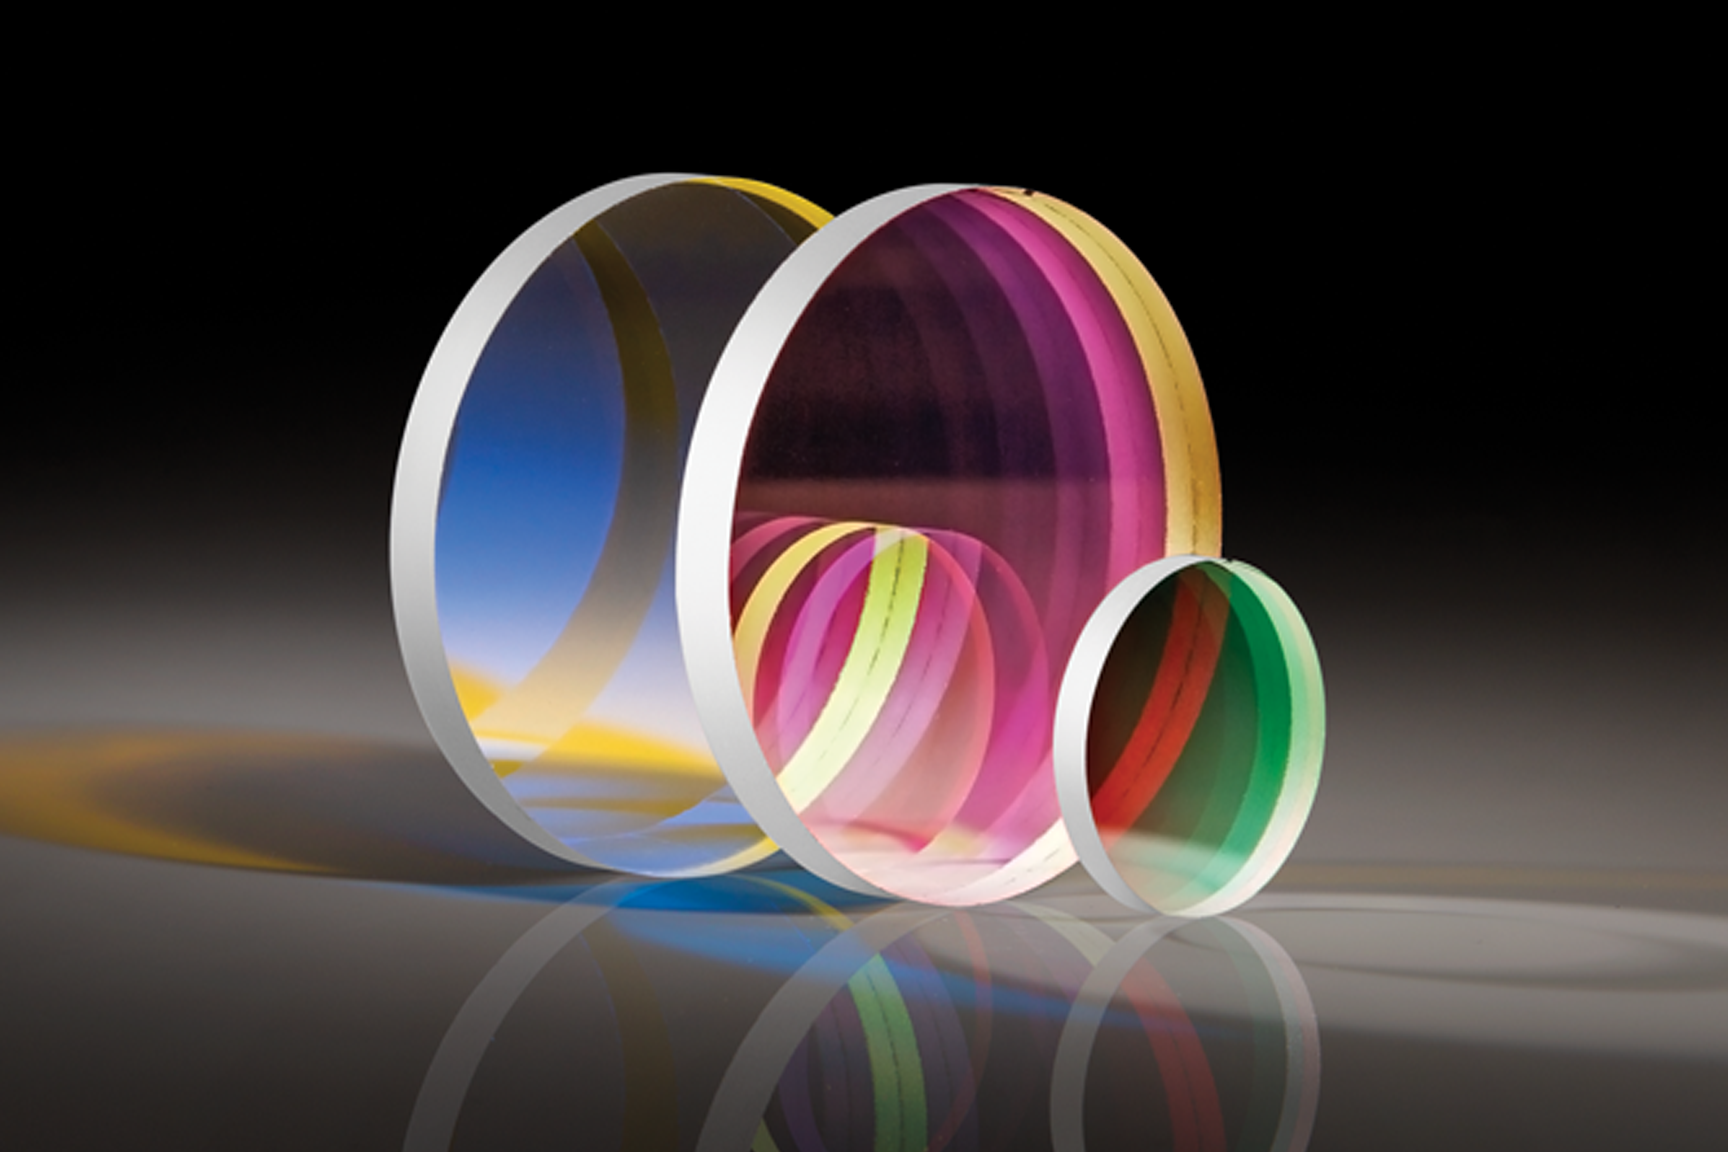
Filtering
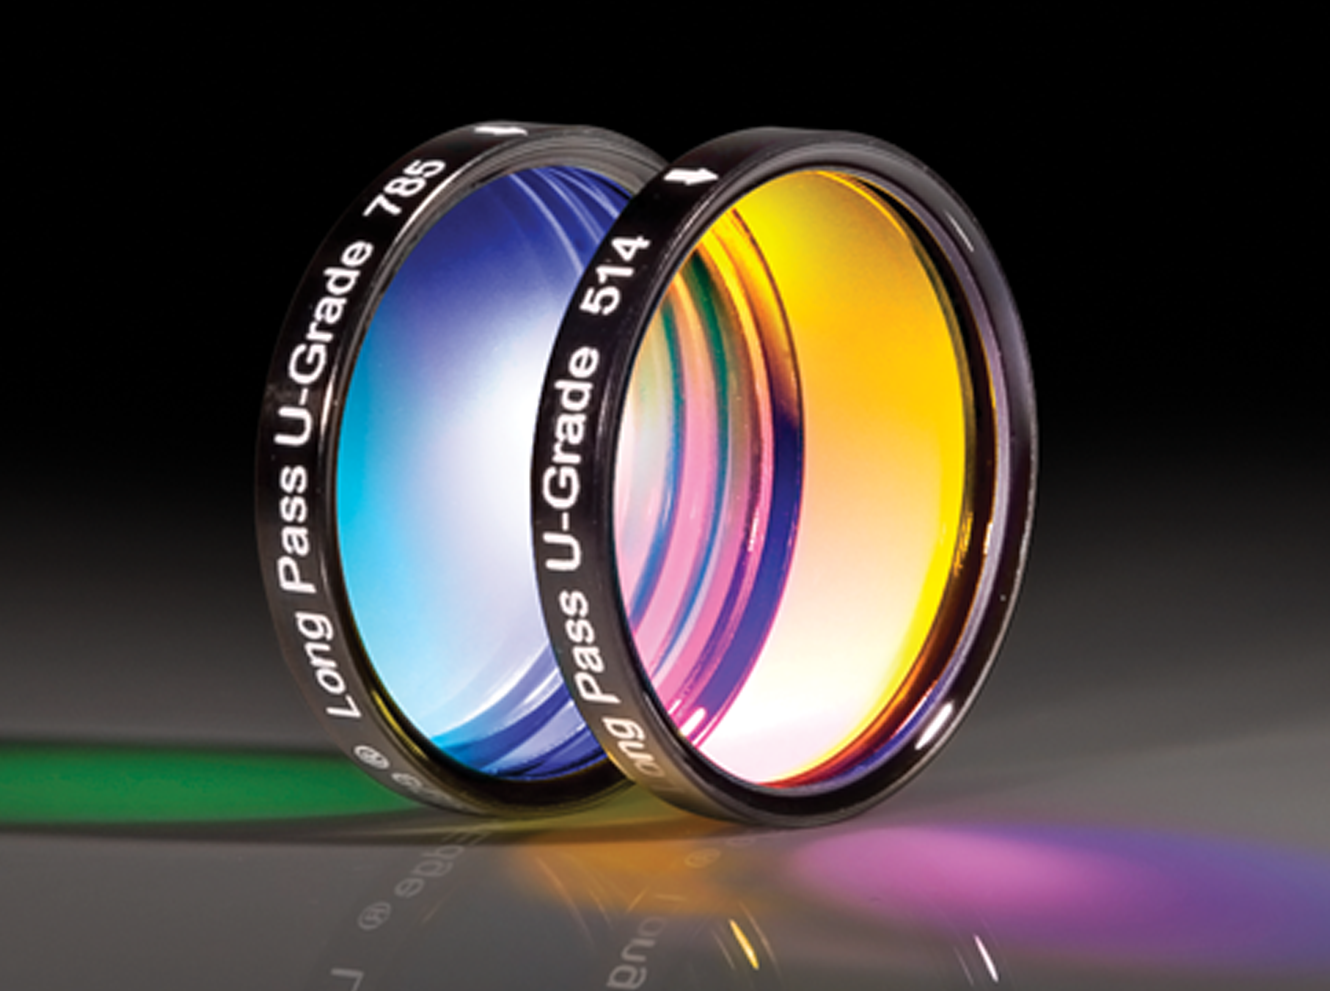
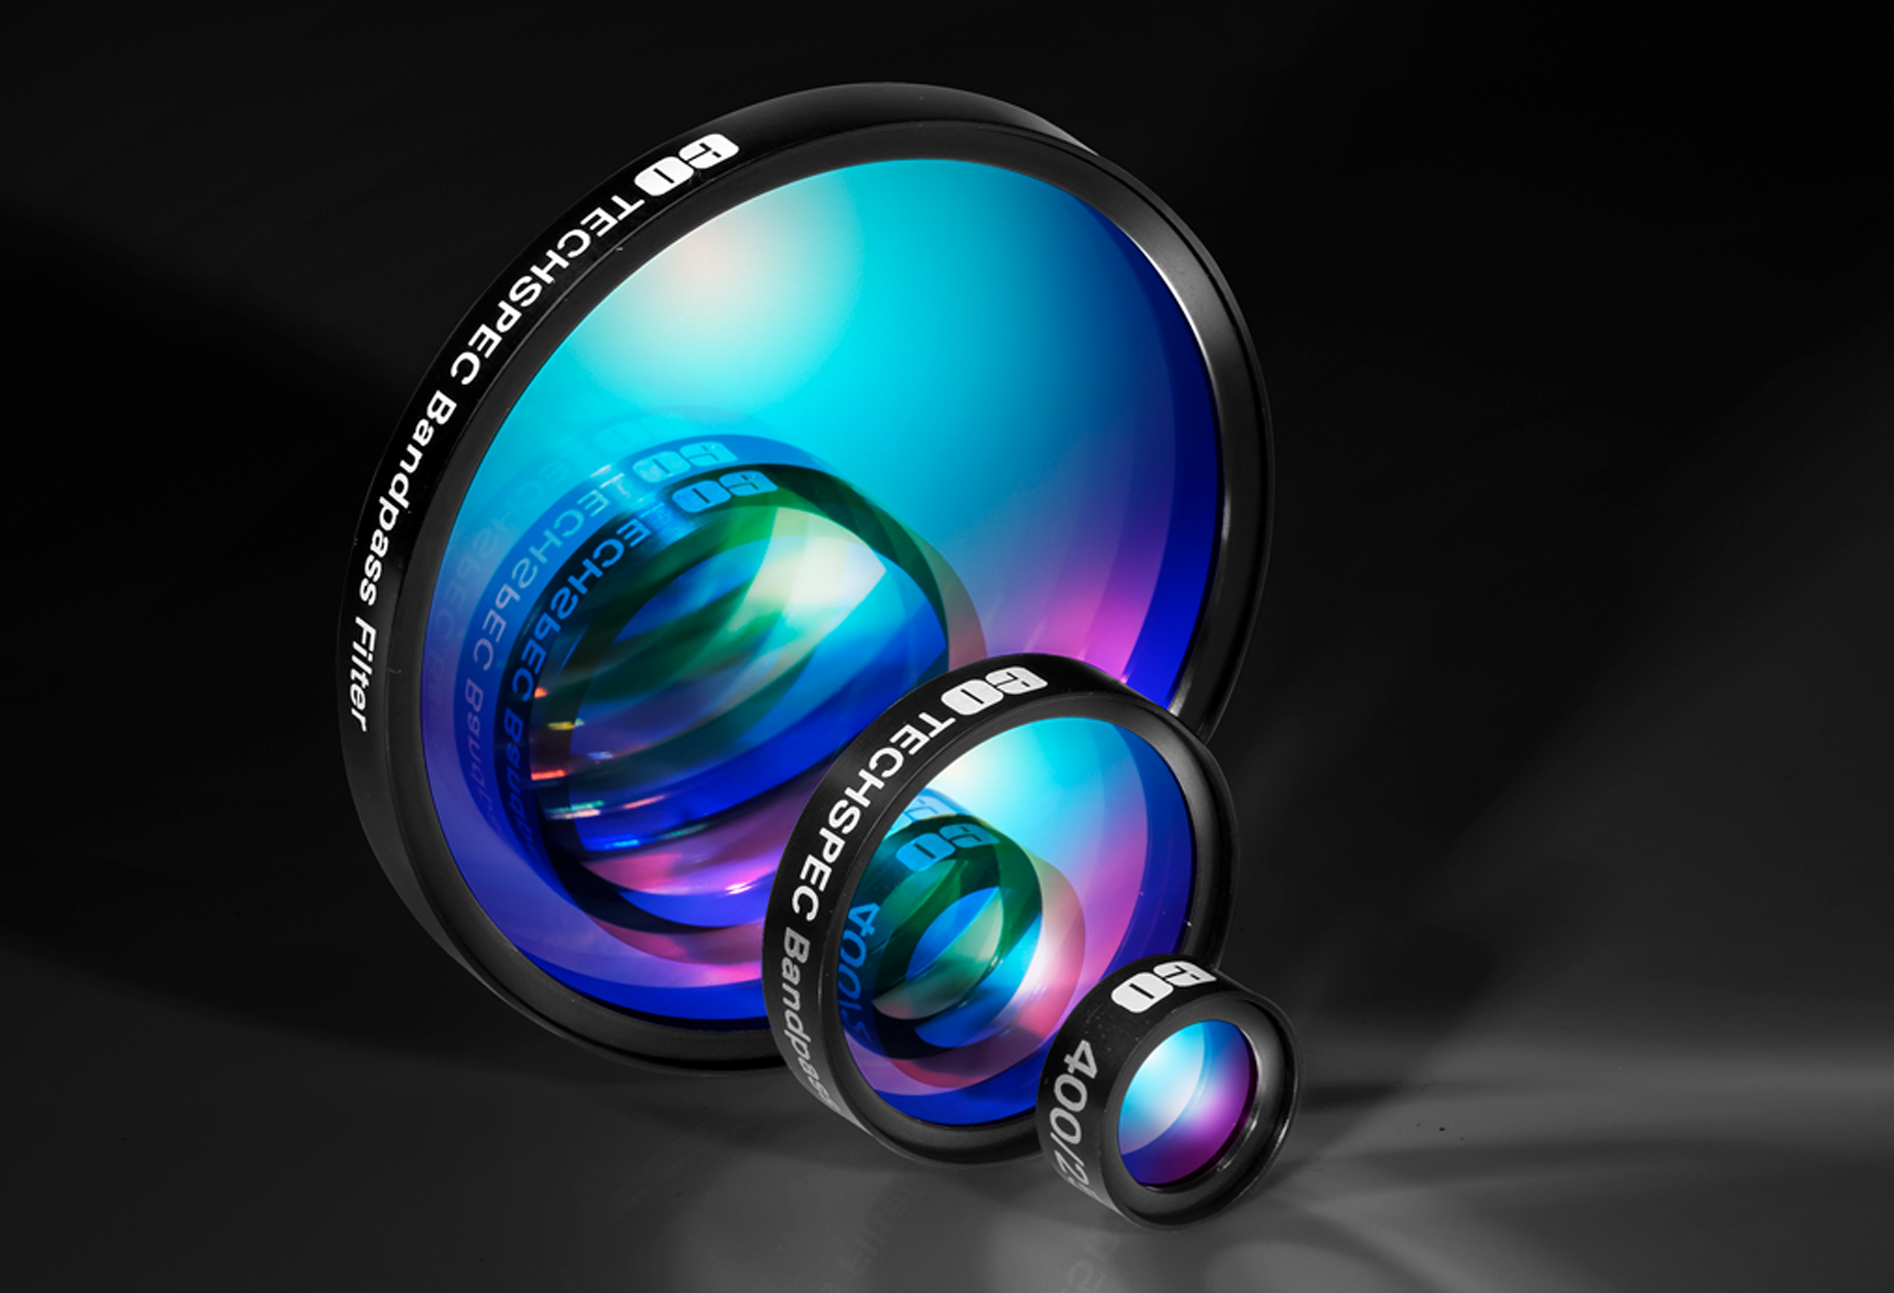
A clean excitation signal is a vital component in a Raman spectroscopy experiment to ensure that scatter data is measured accurately. To make certain that only the desired signal is detected, high-performance bandpass and longpass filters complement each other well in this regard. When incorporated into a system (Figure 3), the high transmission and narrow bandwidth of the bandpass filters eliminate noise and ensure that only the desired laser line reaches the sample. Then, the longpass filter is incorporated after the laser interacts with the sample to allow wavelengths longer than the excitation wavelength to pass, which are characteristic of Stokes Raman scattering.
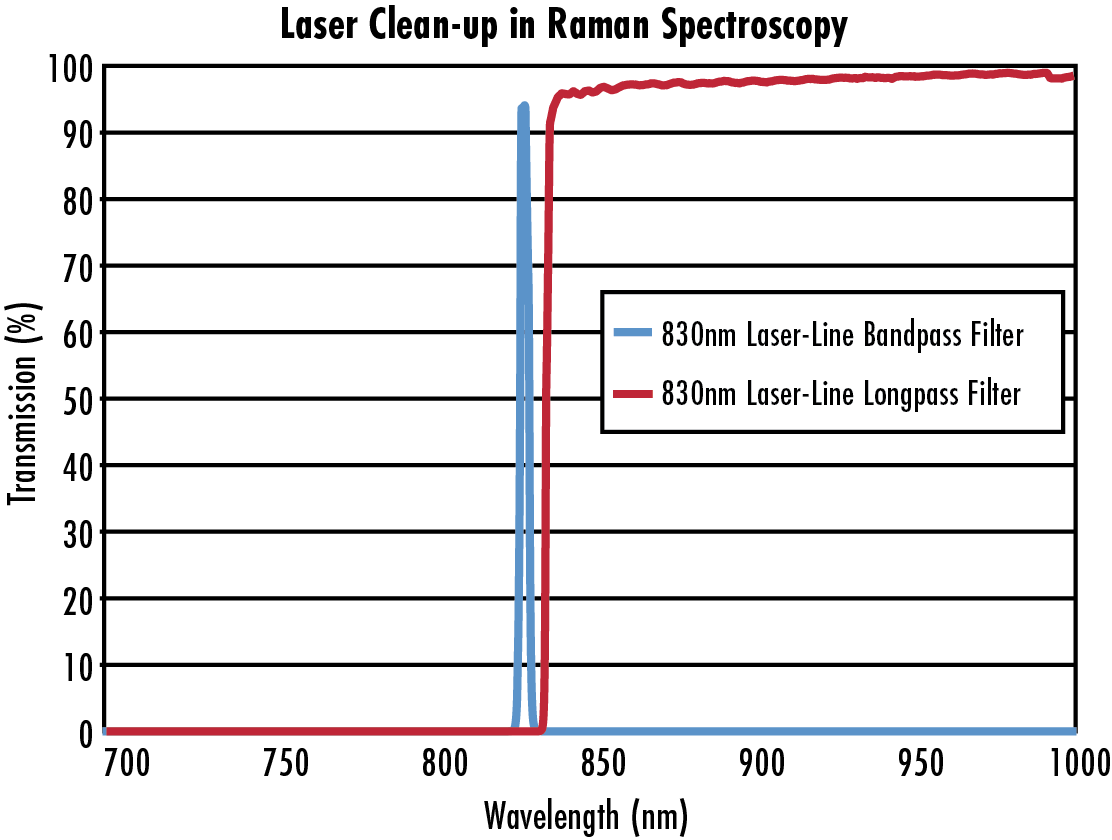
Figure 4: The bandpass filter is used to clean the beam before it enters the system, and the longpass filter is used to ensure only Stokes Raman scatter passes through to detection.1
Advanced Raman Spectroscopy Techniques
Since normal Raman scattering produces an extraordinarily small signal, researchers have discovered several mechanisms in order to combat the low signals associated with Raman spectroscopy by enhancing the probability of Raman scattering. Signal enhancement can be achieved by using two theories. The first of which is Surface-Enhanced Raman Spectroscopy (SERS), which uses metallic surfaces to amplify the local electric field, increasing the chance of Raman Scattering and resulting in a higher intensity output.7 Alternatively, chemical enhancement is done under resonance Raman spectroscopy, which occurs when the frequency of the incident light is close to the frequency of an electronic absorption band in the molecule increasing the intensity of the Raman effect.8
Raman spectroscopy is also frequently integrated into microscopy techniques, an example of which is confocal microscopy. The microscopes used in these instances differ from traditional microscopes in that they include additional components such as an excitation laser, laser filters, and a spectrometer. The Raman setup can be integrated seamlessly into the regions in the microscope’s optical path in which light is collimated after leaving an infinite conjugate objective. To aid this process, longer tube lengths may be beneficial for fitting the additional components into the system. Using Raman spectroscopy at the microscopic level is beneficial for analyzing microscopic structures for chemical identification.
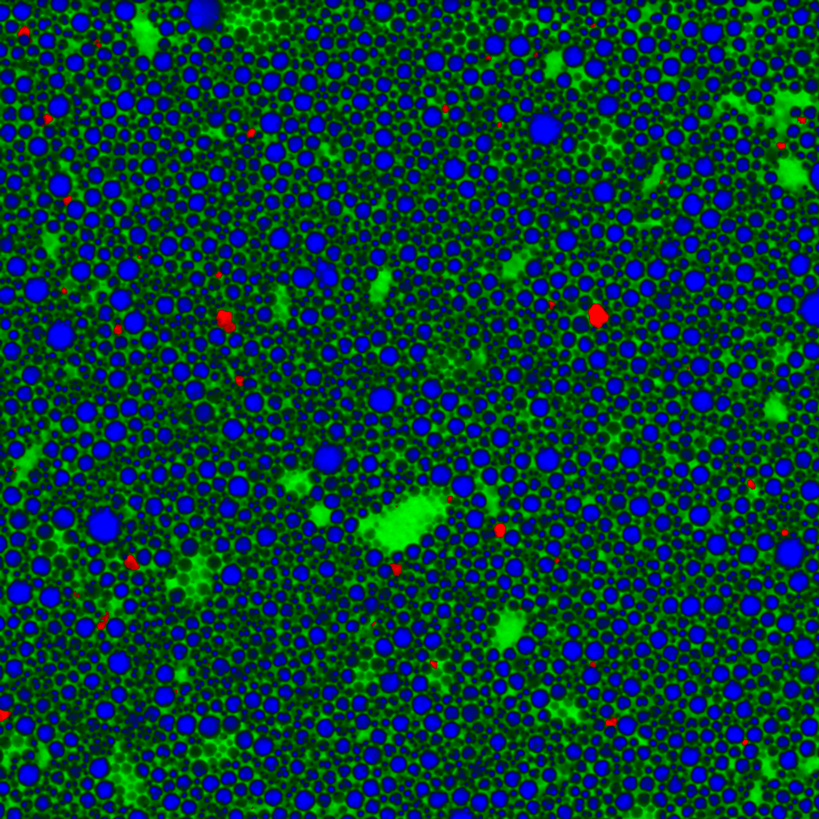
Figure 5: Confocal Raman image of a pharmaceutical emulsion. The chemical distribution of oil (green), the active pharmaceutical ingredient (blue) and silicon impurities (red) are shown.9
Raman spectroscopy is also useful for enhancing traditional biomedical imaging. With the aid of the Raman technique, imaging can be performed in vitro, to allow for visualization of biological structures within living organisms. Additionally, high-resolution images can be obtained using confocal microscopy in conjunction with Raman spectroscopy. This has led to improved spatial resolution for 3D imaging.10
Growing Applications
Raman spectroscopy can be utilized in a variety of applications. It is incredibly useful to those involved in life sciences because the spectrum analyzed through this method provides accurate and unique identifiers of specific molecules. For example, Raman spectroscopy is commonly used as a technique to identify pharmaceutical drugs. Measurements can be taken through plastic bottles, checking drugs without contaminating them by opening the bottle.11 Border patrol agents use hand-held Raman spectroscopy devices to quickly and accurately analyze the spectra of unknown confiscated substances. By comparing the spectra from the unknown substances to those of illegal drugs like fentanyl, officials can safely dispose of dangerous substances. Learn more in our Using IR Spectroscopy for Counterfeit Drug Detection case study. In addition to its practicality, samples can be used without any extra additives or preparation, making Raman spectroscopy not only useful, but also portable and efficient.
Portable Raman spectroscopy devices are also helpful when used on-site to quickly identify specimens, such as in forensic analysis or in point-of-care clinical settings. These hand-held devices are extremely valuable when scanning hazardous samples as they can determine chemical composition while keeping the material in packaging.12 Similarly, the Department of Defense uses Raman spectroscopy to analyze explosive materials through clear containers without accidental explosion.12 These, of course, are not the only instances where Raman techniques are applicable. Raman spectroscopy is used in other disciplines, such as in chemistry, to identify structures at the molecular level; in the field of materials science to view the stress and strain of a material; in geology to identify different gemstones; and in art to identify unknown pigments or paints.
Raman spectroscopy is a powerful technique for identifying unknown substances. When creating a Raman spectroscopy system, it is vital to select the correct optical components. Choosing the right mirrors, lenses, prisms, filters, and other components can help minimize noise and light loss to be able to meet the requirements for any given application. From archaeology to the diagnosis of disease, this laser-based diagnostic method is critical for a variety of different fields.
Raman Spectroscopy at Edmund Optics®
Edmund Optics supplies a wide range of components for Raman spectroscopy systems including mirrors, prisms, lenses, laser sources, and optomechanics. More components ideal for these systems are continuously added as the Raman spectroscopy application space continues to grow.
Laser Line Longpass Filters
- Up to 93% Transmission to Detect Weak Signals
- Deep > OD 6 Blocking for Maximum Laser Rejection
- Ideal for Raman Spectroscopy
BUY NOW
Full Range of Bandpass Filters
- Wide Range of Sizes, Wavelength Ranges, and OD Values
- Selection Table Allows for Easy Navigation of Options
- Eliminate Signal Noise and Ensure Only Desired Wavelengths Reach Sensor
BUY NOW
 Full Range of Longpass Filters
- Wide Range of Sizes, Wavelength Ranges, and OD Values
- High Blocking and Narrow Transition Eliminates Excitation Signal
- Allows for Accurate Measurement of Wavelengths Close to Laser Line
BUY NOW
Laser Line Mirrors
- High Reflectivities to Maximize System Throughput
- Wide Variety of Sizes and Coatings
- Designs Tailored for Nd:YAG Lasers and Other Common Laser Sources
BUY NOW

Right Angle Prisms
- Surface Flatness Down to λ/20
- Wide Variety of Sizes, Coatings, and Materials
- Fold Optical Beam Paths Throughout Raman Spectroscopy Systems
BUY NOW

Achromatic Lenses
- Focus Light onto the Detector in Raman Systems
- Correct for Chromatic and Spherical Aberrations
- Wide Variety of Sizes, Coatings, and Materials
BUY NOW

Optomechanics
- Optical Mounts, Benchtop Systems, Translation Stages, Optical Tables, and More
- Kinematic Mounts for Positioning Mirrors and Other Optics
- Provide Both Stability and Accuracy
BUY NOW
References
- Bishop, E., & Optics, E. (2023, January 3). Raman spectroscopy identifies disease characteristics and in vitro structure. Photonics.com: Optics, Lasers, Imaging & Fiber Information Resource. https://www.photonics.com/Articles/Raman_Spectroscopy_Identifies_Disease/a68649
- Libretexts. (2022). 4.3: Raman Spectroscopy. Chemistry LibreTexts. https://chem.libretexts.org/Bookshelves/Analytical_Chemistry/Physical_Methods_in_Chemistry_and_Nano_Science_(Barron)/04%3A_Chemical_Speciation/4.03%3A_Raman_Spectroscopy#:~:text=Due%20to%20the%20lack%20of,be%20seen%20in%20Figure%204.3
- Tuschel, D. (2016, March 1). Selecting an Excitation Wavelength for Raman Spectroscopy. Spectroscopy Online https://www.spectroscopyonline.com/view/selecting-excitation-wavelength-raman-spectroscopy
- R. Bausinger (2015). Raman spectroscopy setup and experiments for the advanced undergraduate lab. Proc ETOP, Article No. TPE31.
- How to choose lasers for Raman Spectroscopy - HÜBNER Photonics. (2021, October 8). HÜBNER Photonics. https://hubner-photonics.com/knowledge-bank/how-to-choose-lasers-for-raman-spectroscopy/#:~:text=Laser%20wavelength%3A-,The%20most%20commonly%20used%20wavelength%20in%20Raman%20spectroscopy%20is%20785,%2C%20high%2Dquality%20laser%20sources
- Gilmore, J. (2011, February). Selecting CCDs for Raman Spectroscopy. Photonics.com: Optics, Lasers, Imaging & Fiber Information Resource. https://www.photonics.com/Articles/Selecting_CCDs_for_Raman_Spectroscopy/a45915
- AZoNano.com. (2022, June 28). Using Metal Nanoparticles in Surface-Enhanced Raman Spectroscopy. https://www.azonano.com/article.aspx?ArticleID=6200#:~:text=Gold%20and%20silver%20are%20two,fields%20such%20as%20biomedical%20imaging
- Akiko Y. Hirakawa Masamichi Tsuboi, Molecular Geometry in an Excited Electronic State and a Preresonance Raman Effect. Science 188, 359-361(1975). DOI:10.1126/science.188.4186.359
- Sonjajnos. (2018). Confocal Raman image of a pharmaceutical emulsion [PNG]. Wikipedia. https://en.wikipedia.org/wiki/File:Confocal_Raman_Image_of_a_pharmaceutical_emulsion..png#filelinks
- Di, Y. (2021). Guide to Raman Spectroscopy. Bruker. https://www.bruker.com/en/products-and-solutions/infrared-and-raman/raman-spectrometers/what-is-raman-spectroscopy.html
- S. Wachsmann-Hogiu et al. (2009). Chemical analysis in vivo and in vitro by Raman spectroscopy — from single cells to humans. Curr Opin Biotechnol, Vol. 20, No. 1, pp. 63-73 www.doi.org/10.1016/j.copbio.2009.02.006
- Handheld Raman Spectroscopy. (2023, July 7). Rigaku. https://www.rigaku.com/techniques/handheld-raman
- Langford, C., & Langford, C. (2017, December 12). Explosives Identification Using Raman Technology. Identifying Threats. https://www.thermofisher.com/blog/identifying-threats/explosives-identification-using-raman-technology/


or view regional numbers
QUOTE TOOL
enter stock numbers to begin
Copyright 2025 | Edmund Optics BV, De Maas 22B, 5684 PL Best, The Netherlands
California Consumer Privacy Acts (CCPA): Do Not Sell or Share My Personal Information
California Transparency in Supply Chains Act
This content may include material that has been generated or modified using artificial intelligence (AI).
The FUTURE Depends On Optics®